Topic: grafana

Grafana launches new infrastructure and cost-monitoring capabilities
Grafana Labs has introduced new capabilities for its observability platform Grafana Cloud to help Kubernetes platform teams lower cloud costs and improve unified monitoring for their cloud-native infrastructure. “Kubernetes leveled up platform engineering and redefined how global distributed teams could access shared infrastructure – but teams have to use multiple different platforms to cover the … continue reading
Grafana’s new tool enables code-level observability
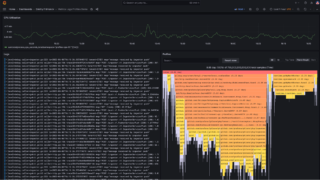
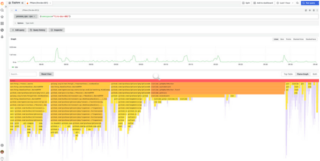
The observability company Grafana is hoping to enable companies to unify different observability signals with the launch of Grafana Cloud Profiles. This new solution allows users to better take advantage of profiling, which offers insights into why a system is behaving as it is, at the code level. “It doesn’t merely append another pillar — … continue reading
ITOps Times Open-Source Project of the Week: Grafana Phlare
Grafana Phlare is an open-source observability tool for continuous profiling at a massive scale. This helps users get a better understanding of resource usage in their applications down to the line number. The project was announced in 2022 at ObservabilityCON. The project natively integrates with Grafana, making it possible for users to correlate their profiling … continue reading
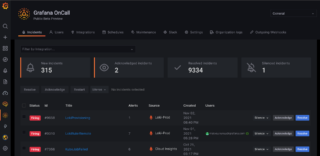
ITOps Times Open-Source Project of the Week: Grafana OnCall
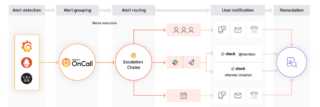
Grafana Labs recently open-sourced its solution for managing on-call employees, Grafana OnCall. It was developed in 2018 at Amixr, which was previously the name of the tool as well. Grafana Labs acquired Amixr in 2021 and then launched the tool on Grafana Cloud. It integrates with your monitoring system so that when something abnormal is … continue reading
Grafana 9.0 available with new visual query builder
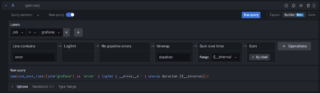
Grafana Labs is introducing new visualizations and alerting improvements in the latest version of its platform, which is Grafana 9.0. A new visual query builder is available for Prometheus and Grafana Loki, as writing queries for those data sources can be a barrier for those new to those tools. By offering a visual builder, users … continue reading
Grafana Labs releases new on-call management tool and tracing solution
Grafana Labs has announced new updates to its observability platform, such as Grafana OnCall and Grafana Enterprise Traces. Grafana OnCall is an on-call management tool that came about because of the company’s acquisition of Amixr. It can be used to easily create and manage on-call schedules. It is designed to allow for faster resolution times … continue reading

ITOps Times news digest: Google Cloud’s Grafana plugin, NS1’s traffic automation platform, and Quantum and Supermicro collaboration
Google Cloud has announced updates to its Cloud Monitoring plugin for Grafana. It has added sample dashboards for Google Cloud services, a deeper link between Grafana and Google Cloud Monitoring, an improved query interface, and a new Monitoring Query Language (MQL) interface. “The observability of metrics is a key factor for a successful operations team, … continue reading
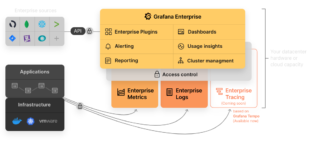
ITOps Times news digest: Grafana Enterprise Stack, Solo.io Gloo Mesh Enterprise, and StorCentric QV1020
Grafana Labs has announced the release of Grafana Enterprise Stack, which is an observability platform. The new solution includes Grafana Enterprise, Enterprise Metrics, and Enterprise Logs, which is a log aggregation solution based on Loki. “At Grafana Labs, we’re committed to providing our customers with the choice between cloud-based observability in Grafana Cloud, or the … continue reading

ITOps Times news digest: Rancher Academy, Grafana 7.0, and HashiCorp Consul 1.8
Rancher Labs has announced a new certification program, Rancher Academy. Rancher Academy will provide video introductions, theory work, demonstrations, hands-on labs, quizzes, and a final exam. According to Rancher Labs, this certification will provide IT professionals with in-depth knowledge on deploying, using, and managing Kubernetes using Rancher. Grafana 7.0 Grafana has announced the latest version … continue reading
Grafana Labs raises $24 million for composable observability platform
Grafana Labs just announced the completion of a Series A funding round of $24 million. The round was led by Lightspeed Venture Partners with participation from Lead Edge Capital. Grafana Labs is known for its open-source projects Grafana and Loki. Grafana allows teams to query, visualize, and alert on metrics and logs. Loki is a … continue reading
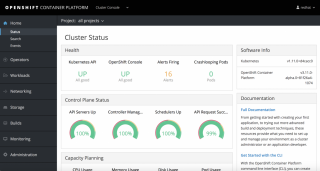
Red Hat’s OpenShift Container Platform 3.11 is now available
Red Hat has released version 3.11 of the OpenShift Container Platform. This release ships with Kubernetes 1.11 and includes new features to streamline Day 2 cluster and application operations. “In short, we’ve made central administration for your clusters, environments, and users easier, while providing expanded Prometheus capabilities for gathering Kubernetes-native metrics,” the company wrote in … continue reading

Instana releases Grafana Premium Datasource Plugin for analytics and monitoring
Application performance monitoring solution provider Instana announced the release of a Grafana premium datasource plugin for their platform today. The Grafana Premium Datasource Plugin for Instana is designed to bring the open-source dashboarding and reporting software to Instana’s containerized microservice-focused APM. The base Instana software automates the management of business-critical applications in containerized environments, automatically … continue reading
