Grafana Labs is introducing new visualizations and alerting improvements in the latest version of its platform, which is Grafana 9.0.
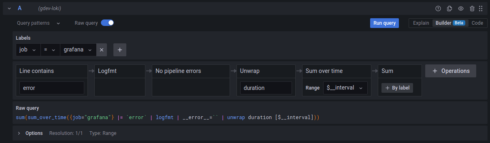
A new visual query builder is available for Prometheus and Grafana Loki, as writing queries for those data sources can be a barrier for those new to those tools. By offering a visual builder, users of any skill level will be able to compose, understand, and learn how to use query languages.
This release also introduces dashboard previews, which allow users to preview the available dashboards, helping them to more quickly determine what dashboard they need. They can also now search for terms in dashboard and panel titles.
The navigation bar also received updates; Now users see a more complete overview of available features and installed integrations. There is also a way to opt in to access starred dashboards from the navigation bar.
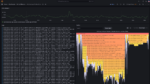
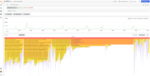
The heatmap panel has been upgraded with performance enhancements. It is now significantly faster and can render multiple time series, each with thousands of data points. The panel also now supports exemplars (traces), overlay, and Prometheus sparse histograms.
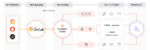
The new alerting system that was introduced in Grafana 8.0 is now the default in Grafana 9.0. The new system unifies Prometheus alerting and Grafana alerting in the same UI. This provides a common experience for users across open source, enterprise, and cloud.
And finally, envelope encryption is now enabled by default, which adds an additional layer of indirection to the encryption process.
“At Grafana Labs, we’re always asking ourselves how we can make observability, monitoring, data visualization, and dashboarding more relevant, powerful, and easy to use, and that has been a huge influence on this 9.0 release,” said Torkel Ödegaard, co-founder and chief Grafana officer at Grafana Labs. We’ve been continuously releasing and refining these aspects of Grafana, and our new query builders, visualizations, alerting, and security measures are the result of that work.”
The company also announced an open-source version of Grafana OnCall, which is a tool for managing on-call employees.
According to Grafana Labs, not all companies have been able to take advantage of the cloud-based version of Grafana OnCall, due to barriers like security requirements, legal issues around sensitive data, or limited connectivity.
By open-sourcing it, companies will be able to install it and manage it themselves, which will enable them to use it while also meeting those needs and requirements.
“We wanted to make OnCall open source as soon as we felt it was ready for users to run it themselves easily and reliably,” said Matvey Kukuy, project co-creator and senior engineering manager at Grafana Labs. “We feel it’s ready now.”