Grafana Phlare is an open-source observability tool for continuous profiling at a massive scale. This helps users get a better understanding of resource usage in their applications down to the line number. The project was announced in 2022 at ObservabilityCON.
The project natively integrates with Grafana, making it possible for users to correlate their profiling data with metrics, logs, and traces and to use profiles as another key observability signal for their applications.
The tool has consistent architecture with Loki, Mimir, and Tempo, which reduces the learning curve and cognitive load for those operating Phlare alongside Grafana Labs’ other databases.
Multi-tenancy and isolation also make it possible to run one database for multiple independent teams or business units.
The tool works by collecting CPU and memory profiles from applications that expose ‘pprof endpoints’. Phlare is then spun up as a single process, but users can add more machines and horizontally scale it out.
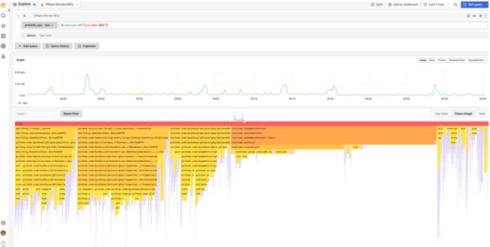
Grafana’s Phlare data source enables you to query and analyze the data stored in Phlare, with the ability to break it down into smaller pieces by specific time ranges and labels. Additionally, Grafana’s flame graph, histogram, and table views provide a visual representation of your profiling data and offer the capability to construct comprehensive dashboards.
Lastly, the tool helps users identify the slowest and most memory-hungry parts of your code, so that developers are empowered to go in and optimize those areas.