The observability company Grafana is hoping to enable companies to unify different observability signals with the launch of Grafana Cloud Profiles.
This new solution allows users to better take advantage of profiling, which offers insights into why a system is behaving as it is, at the code level. “It doesn’t merely append another pillar — it challenges the whole notion of separate pillars. Instead, it promotes a holistic, integrated viewpoint of system health and performance,” Ryan Perry, engineering director at Grafana Labs, wrote in a blog post.
The new solution allows profiling to be integrated with metrics, logs, and traces. According to Perry, this seamless integration will help break down silos between different pillars of observability.
“Continuous profiling brings a dynamic, granular perspective to resource usage. It merges the realms of logs, metrics, and traces into an interconnected landscape, providing a unified, comprehensive view of your system,” he wrote.
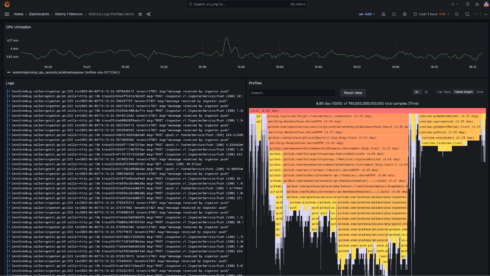
For example, a developer may observe an increase in CPU utilization and a decrease in performance, and then with profiling they will be able to discover what functions in the code are consuming CPU cycles.
Another use case would be tracking memory allocation for specific lines of code. “This information, when viewed alongside the logs, can help you quickly identify memory leaks or inefficiencies and rectify them, significantly reducing your debugging time,” Perry wrote.