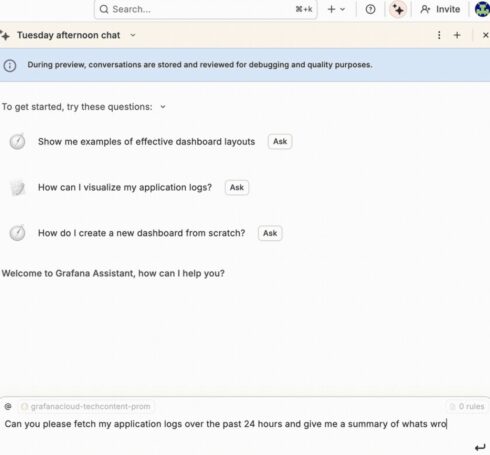
Grafana Labs announced a public preview of Grafana Assistant, an AI assistant that IT teams can use to interact with logs, metrics, and traces in a conversational manner.
It is available in all parts of Grafana Cloud, and sees the context of what is on the page so that it can give specific, context-aware answers. Users can ask questions like “what am I supposed to do on this page?” or “can you explain the data I’m seeing here?”
Grafana Assistant can also guide users through interactive tutorials for completing tasks, such as adding an alert to a metric, adding a new on-call schedule in Grafana Cloud IRM, or how to declare a test incident.
It also provides guidance and best practices for observability, based on Grafana’s documentation, blog content, and community knowledge.
Additionally, the assistant can be used to learn about general observability concepts, such as what an aggregated metrics is or what an SLO stands for. The answers are tailored to a company’s specific observability stack, so if a user asks about uptime and they have HTTP servers logging and providing metrics to Grafana, the assistant will be able to figure out what they’re referring to.
Users can also ask about concepts from different observability platforms to compare how it is implemented in Grafana.
“There’s no doubt that AI is accelerating the pace of innovation. As more organizations adopt a software-driven mindset, they’re using AI to rewire how they operate, from revenue and operations to reliability and customer experience,” said Tom Wilkie, CTO of Grafana Labs. “That’s why we built Grafana Assistant: a context-aware AI agent that helps teams move from signal to action faster, right inside the tools they already use. Tools like this – along with other AI-powered capabilities in our open observability cloud, like Asserts knowledge graph and Adaptive Telemetry – are helping companies navigate growing digital complexity and act with greater clarity and speed.”


