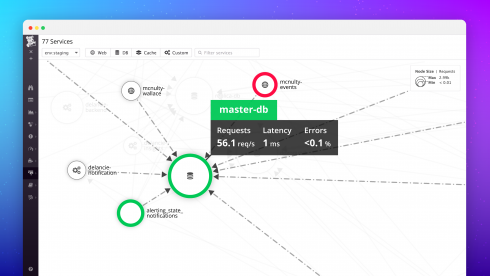
Cloud-scale application monitoring service provider Datadog introduced the Datadog Service Map today, providing a visualization of the services and dependencies of users’ applications being monitored by the Datadog APM to track failures and bottlenecks.
“As more organizations break monoliths up into microservices and embrace containerization, the fault domain within each application component has shrunk,” Michael Gerstenhaber, director of product management with Datadog, wrote in a blog post. “But there are tradeoffs for that decoupling: application architecture has become more complicated overall, and the communication pathways and dependencies between components have multiplied. That complexity makes it difficult for anyone to form an accurate picture of the application, from new team members learning the ropes during onboarding to experienced engineers responding to a page in the middle of the night.”
According to the company, Datadog Service Map’s visualization groups interdependent pieces of users’ application architecture together in intelligently determined clusters.
“Services within each cluster rely on other services within the cluster, sometimes exclusively,” Gerstenhaber wrote. “Services that have dependencies inside and outside of the cluster gravitate toward the cluster’s perimeter and often represent a bottleneck for the services behind them.”
The new utility also tracks calls across disparate services and host platforms, and displays that data, along with run times, in flame graphs.
“Understanding the dependencies between services is vital to meeting service level objectives, and the Service Map makes these relationships immediately apparent,” Gerstenhaber wrote.
Other features include ability to narrow focus with filtering, providing insight into dependencies between services, monitoring specific services, and a single place to view APM data.
“The new Datadog Service Map provides the insight that you need to maintain operational performance and cut mean time to repair for critical components—without the messy whiteboard diagrams that are outdated by the time you finish drawing them,” Gerstenhaber wrote.


