In an effort to simplify application observability adoption, Grafana introduces Grafana Beyla, an open-source eBPF auto-instrumentation tool currently in public preview.
Beyla offers span information for fundamental transactions and RED metrics (Rate-Errors-Duration) for Linux HTTP/S and gRPC services, all without the need for manual code modifications to insert probes.
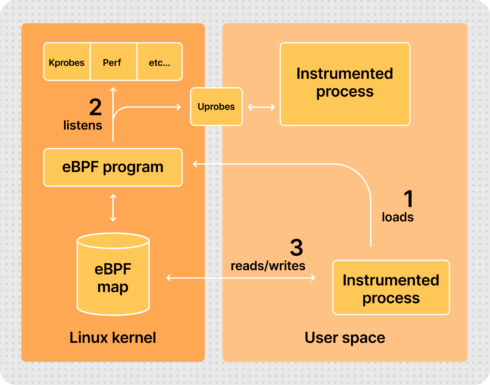
eBPF, short for Extended Berkeley Packet Filter, permits the attachment of custom programs to various locations within the Linux kernel. These eBPF programs operate in privileged mode, allowing the inspection of runtime information across the kernel, including system calls, the network stack, and the insertion of probes into user space programs.
One notable aspect of eBPF is its safety, according to Mario Macías, senior software engineer at Grafana Labs in a blog post. The programs are compiled for a specific virtual machine instruction set and then run in a secure sandboxed environment. This pre-verifies each loaded program, ensuring safe memory access and finite execution time. This stands in contrast to older technologies like Kprobes and Uprobes, which, if programmed poorly, could potentially lead to kernel instability.
Grafana Beyla is currently in public preview, with plans to incorporate metrics for additional established protocols such as databases and message queuing connections in the future.
The development team also aims to implement distributed tracing, allowing users to correlate spans with requests from other services like web, database, and messaging. While this is a complex endeavor due to implications such as handling client-side headers in the same context as server-side requests, they plan to make gradual improvements in this area.
Another upcoming task involves reducing the code surface that requires administrative privileges. This includes running a small eBPF loader with root or CAP_SYS_ADMIN privileges and executing the rest of data processing and exposition with normal user privileges.