For me, the most important thing monitoring can provide is the ability to see what is happening inside your clusters–be it the state of the workload, or the status of the applications–is significant and should not be a day two concern. Good information on your clusters allows you to react quickly to misconfigured deployed applications, catching rollouts gone wrong and so on.
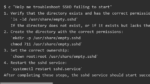
In this article, we will focus on gathering and presenting monitoring and metrics using Prometheus. In the past few years, Prometheus has evolved to be the defacto standard for monitoring solutions in the container ecosystem. It’s an open source monitoring and alerting project under the CNCF, and it complements Kubernetes well. Prometheus works by collecting metrics from the configured targets at specified intervals and then displays those results. Using Alertmanager you can route the alerts that Prometheus triggers based on the alerting rules you specify, which are derived from the metrics being scraped.
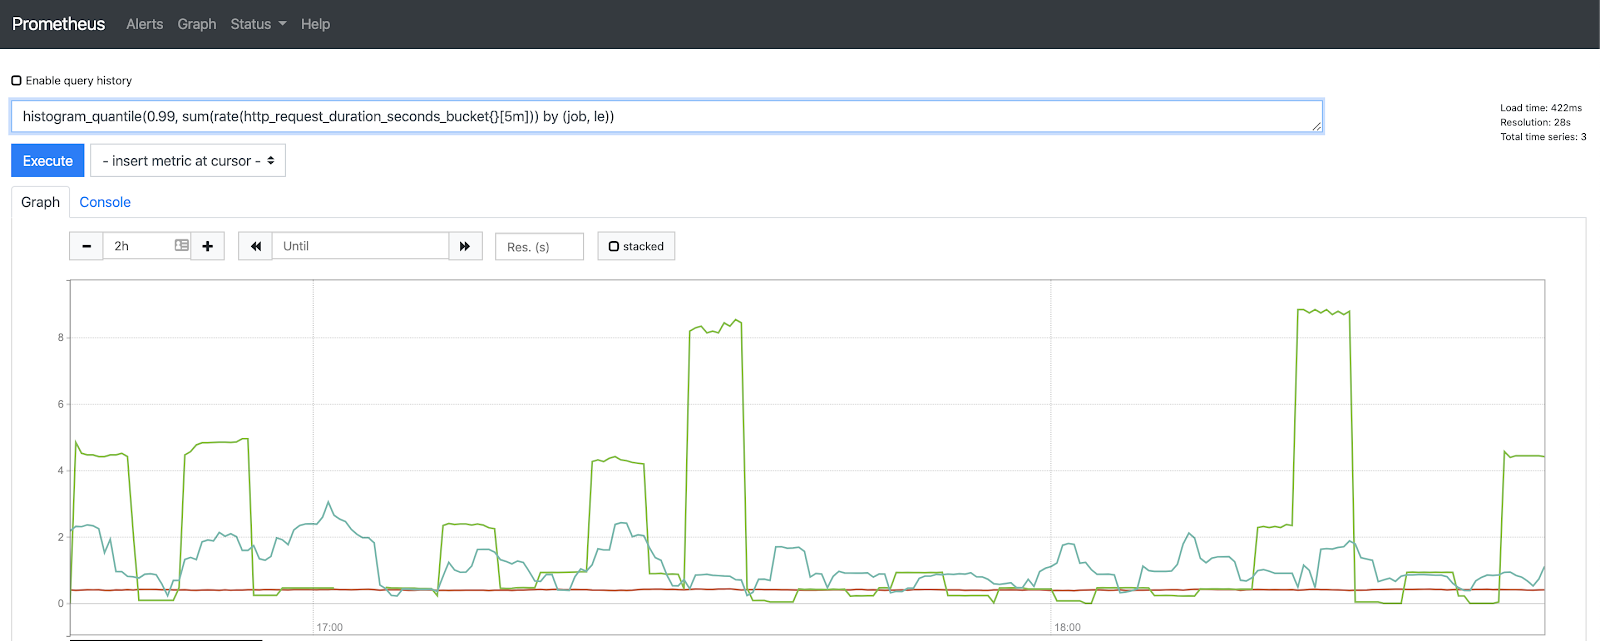
Picture: Example of metric query in the Prometheus UI
What is kube-state-metrics and why you should use it in your clusters?
kube-state-metrics, a project under the Kubernetes organization, is an addon agent that, when deployed in the Kubernetes cluster generates Prometheus metrics based on the current Kubernetes cluster objects. If you are not running this in your Kubernetes clusters, you should consider using it.
What we wanted to achieve with kube-state-metrics is to give users the ability to automate and alert on data. This data would typically only be able to access through kubectl, most likely way after there had already been an incident. As a matter of fact, that is the origin story of how our team got involved in kube-state-metrics as Frederic Branczyk described in his talk at PromCon 2017.
On a technical level, kube-state-metrics works by performing a list/watch in given namespaces on the specific Kubernetes native resources. It mirrors the object’s states and translates them into Prometheus metrics. It produces over 1,000 time-series on a simple cluster, and it observes everything from pods to persistent volumes.
Here is a small snippet of metrics produced by kube-state-metrics:
“`
# HELP kube_pod_container_info Information about a container in a pod.
# TYPE kube_pod_container_info gauge
kube_pod_container_info{namespace=”monitoring”,pod=”prometheus-operator-658766d58-gqkx4″,container=”prometheus-operator”,image=”quay.io/coreos/prometheus-operator:v0.33.0“} 2
kube_pod_container_info{namespace=”monitoring”,pod=”alertmanager-main-1″,container=”alertmanager”,image=”quay.io/prometheus/alertmanager:v0.18.0“} 1
# HELP kube_pod_container_status_waiting Describes whether the container is currently in waiting state.
# TYPE kube_pod_container_status_waiting gauge
kube_pod_container_status_waiting{namespace=”monitoring”,pod=”prometheus-k8s-0″,container=”prometheus”} 0
kube_pod_container_status_waiting{namespace=”monitoring”,pod=”prometheus-k8s-0″,container=”prometheus-config-reloader”} 3 kube_pod_container_status_waiting{namespace=”monitoring”,pod=”prometheus-k8s-0″,container=”rules-configmap-reloader”} 0
“`
Let’s have a quick look at an example alerting rule created based on the kube-state-metrics’ deployment metric. The following returns deployments that have a mismatch in their expected and available replicas. This would often be the case when there was a bad rollout happening, and the pods could not be created correctly.
“`
kube_deployment_spec_replicas{job=”kube-state-metrics”} != kube_deployment_status_replicas_available{job=”kube-state-metrics”}
“`
Why there are no Operator metrics in kube-state-metrics?
As mentioned above, kube-state-metrics exposes only metrics about the Kubernetes native resources, while Operators typically register custom resources. While you can switch the resources that kube-state-metrics generates on and off, there is no option to pass in your custom resource objects. This is because of the custom nature of Custom Resources, as they are not predefined, we cannot know what data in the custom resource would be suitable for metric generation.
As part of our work on Operator SDK, we wanted to have an easy way of generating metrics for each Operator. As Operator SDK is aimed at making the writing of Operators easy, we wanted to do this with minimal user input. We decided to convert kube-state-metrics into a library and use it to help generate code to easily register custom resource metrics. The code is not tied to the Operator SDK underlying clients, so you can use kube-state-metrics independently to easily produce custom resource metrics.
You can learn more by watching Lili Cosic’ lightning talk from KubeCon US in San Diego last week, titled “Easily Observing Operators.”