Search provider Elastic launched version 6.7 of its Elastic Stack suite, featuring the release of real-time services and application monitoring platform Elastic Uptime, the release to general availability of a number of Elasticsearch features, as well as updates for the platform’s new Maps feature.
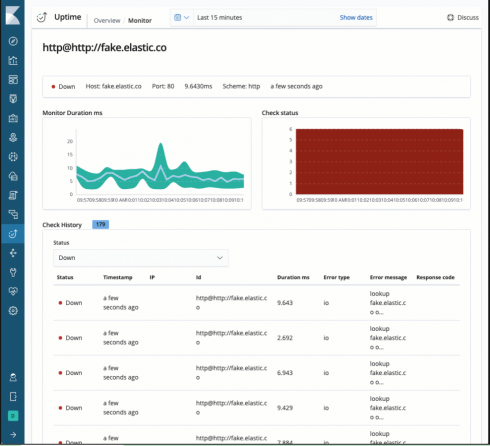
Elastic Uptime, based on Elasticsearch’s Heartbeat plug-in, is a monitoring tool that will give users a heads-up when their app or service is performing slowly or down entirely and can be deployed internally or external of the company’s network.
“Use cases for Uptime solution include: host availability, service monitoring, website monitoring, and API monitoring,” the company wrote in a blog post. “Bringing [application] uptime data alongside logs, metrics, and tracing data in Elasticsearch, means that users can more efficiently track and manage all their data in a single operational store.”
The new generally available features include:
- Cross Cluster Replication, which allows for replicating clusters cross-datacenter and cross-region, with checks in place to ensure integrity.
- Index Lifecycle Management, manages aging indices for cluster performance optimization
- Elasticsearch SQL lets users query Elasticsearch data using SQL
- Canvas, part of the Kibana visualization plug-in, provides live data, helpful for sharing data with a “broader audience”
- Functionbeat, part of the Beats data shipping product, “streams cloud infrastructure logs and metrics into Elasticsearch.”
Finally, with the release of Elastic Stack 6.7, Elastic Maps, an expansion of Kibana’s visualization features, now includes the ability to visualize multiple data on multiple layers and from different sources on the same map, apply dynamic styles, map aggregate and document-level data and control visibility on multiple layers of the map visualization.