Observability platform Rookout has announced the release of new debugging capabilities for Kubernetes.
According to Rookout, debugging complex, cloud-native applications can be difficult even for experienced engineers due to their distributed nature.
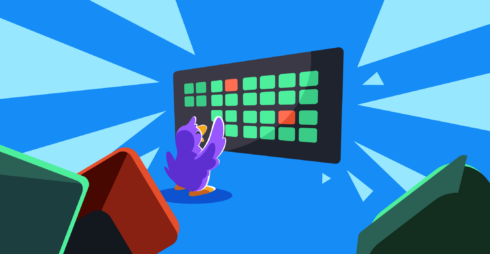
Rookout has attempted to solve this by creating a new UI that groups cloud resources by namespace, pod, and cluster, and highlighting components that need to be debugged.
Developers can troubleshoot entire clusters or specific pods, and indicators are color-coded to group clusters or pods that need the most urgent attention.
“What we are seeing is an important evolution of the Observability space to dynamic instrumentation,” said Shahar Fogel, CEO of Rookout. “Traditional monitoring tools are static — they require engineers to predict what can go wrong in advance in order to set up metrics, logs, and traces. Dynamic observability offers instant, one-click insights into Kubernetes.”
In addition to the new debugging capabilities, Rookout also announced support for Go in addition to existing support for Java, .NET, Node.js, Python, and Ruby.