New Relic is making it easier for IT administrators to track cross-infrastructure bottlenecks with the general availability of distributed tracing in the New Relic APM, released today.
The distributed tracing feature is “designed to give software teams working in modern environments an easy way to capture, visualize, and analyze traces through complex architectures, including architectures that use both monoliths and microservices,” Victor Soares, the product manager for distributed tracing at New Relic wrote in the blog post announcing the release.
“Today’s applications are often composed of hundreds or thousands of separate services built on ephemeral infrastructures,” Soares wrote. “Some of these services are large monoliths built with legacy technologies, while others are clusters of smaller dynamic microservices. Despite the many advantages of these distributed architectures, the exploding number of components and their diversity in language, operating environment, and ownership creates a huge new burden for teams trying to manage them.”
New Relic is hoping to ease this burden by providing the full call graph for requests with distributed tracing, allowing users to track service calls using Java, Node.js, Python and Ruby, for now, with support for .NET and Go coming next, followed by PHP. The utility can trace data collected across multiple languages in the same environment and plot them on scatter and waterfall visualizations.
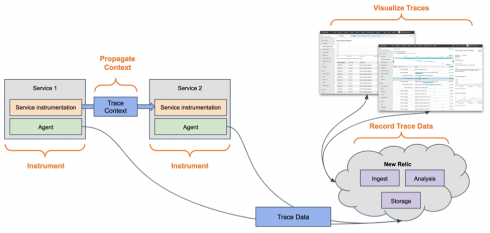
Soares describes the four components of distributed tracing, which the New Relic APM handles directly:
-
- Instrumenting, in which the platform automatically instruments application code with high-compatibility language agents, and separates operations in “spans” that include detailed attributes about the operation.
- Context propagation, in which New Relic APM automatically tracks contextual information surrounding calls. “For example, when one service makes a call to another service, New Relic adds the trace context to the HTTP Request header for the next service to use,” Soares wrote.
- Recording, in which the trace data is sent to New Relic’s SaaS platform for ingestion and storage in New Relic Insights.
- Trace visualization, in which users can see precisely where slow-downs, errors or bottlenecks are occurring.