Kubernetes has become a staple in orchestrating containerized applications. However, despite its utility, Kubernetes-deployed applications and infrastructure generate a ton of data, according to Mezmo in a blog post.
While this data can reveal important key performance indicators (KPIs) like system performance, latency, and user behavior metrics, getting those insights is often tricky due to the volume and complexity of Kubernetes’ telemetry data. Extracting insights from this data often means sifting through verbose logs, indecipherable telemetry data, and a jungle of metrics, the company explained.
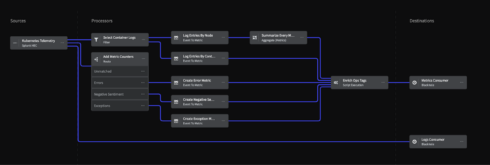
With the new Welcome Pipeline, users can start pulling insights in five minutes or less. They simply need to connect their Kubernetes cluster and configure a few settings, making it that simple.
Users have the option to use the tools they already know; there’s no need for them to learn (or spend on) a new interface. The pipeline seamlessly integrates with popular data observability tools like Grafana or Datadog, tools that users are likely already using and invested in.
The Welcome Pipeline focuses on what matters most to its users: delivering insights that help with their business decision-making. The heavy lifting on the data side is handled by the pipeline, allowing users to concentrate on making informed decisions, according to Mezmo.
The tool also provides users the flexibility to choose how they want to visualize the data, as it doesn’t lock them into using its visualization tools. Users can comfortably use the ones they prefer and tailor their visualizations to meet their unique business needs.
Those who are interested can go to Mezmo’s sign-up page to learn more.


