Pixie Auto Telemetry, an observability tool that provides visibility into Kubernetes applications, is now available as part of New Relic One.
Pixie automatically captures application profiles with function-level granularity, full-body requests, system metrics and the Kubernetes-specific state of pods and services.
“The ever-changing, dynamic nature of Kubernetes environments results in blind spots, and alternative Kubernetes monitoring solutions simply aren’t optimized for developers,” John Withers, the principal product marketing manager at New Relic wrote in a blog post. “Pixie solves for both.”
The instant, no-code baseline visibility uses eBPF to automatically instrument Kubernetes applications as soon as they start running and users never have to redeploy or manually instrument their code.
Pixie’s code-level insights include Flamegraphs for all of the pods in a cluster and function-level granularity for application performance.
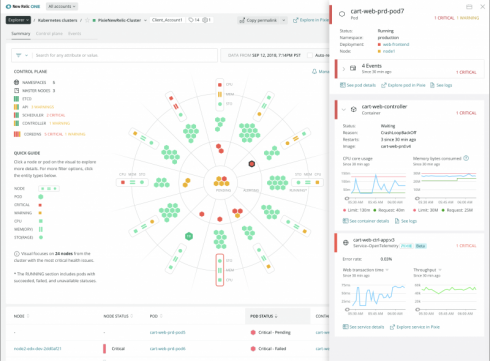
The new integration also provides a bird’s-eye view of clusters so that users can have immediate context into what’s happening, and then developers can correlate the impact application changes are having on your infrastructure and vice versa.