Sysdig announced cloud monitoring at scale with full Prometheus compatibility that addresses the issues that are holding teams back from the organization-wide adoption of Prometheus monitoring.
The company also introduced support for creating dashboards, alerts, and metric analytics based on PromQL, the query language for Prometheus.
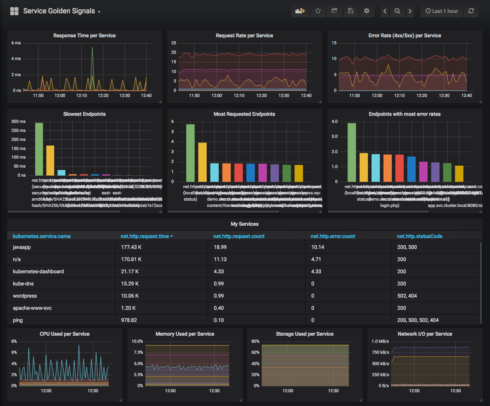
Sysdig said that because monitoring Kubernetes and microservices can be very hard to track, the company launched the Sysdig Secure DevOps Platform that can handle more than 100 million metrics per second, and retain up to 13 months of data. With Sysdig, teams can adopt Prometheus compatible monitoring using an enterprise-ready platform.
“Prometheus brings tremendous value to developers, which is why we standardized our monitoring approach on the open-source project,” said Payal Chakravarty, the vice president of product management at Sysdig. “There are, however, scaling challenges for the enterprise. By extending Prometheus monitoring, we’re able to help enterprises to use the Prometheus monitoring approach they love, while also giving them the scale, workflows, controls, and insights they need to maximize performance and availability.”
Sysdig also released PromCat.io, a free repository of curated Prometheus exporters, dashboards, and alerts to monitor any infrastructure, application, and service running in the cloud. Additional details on PromCat.io are available here.
Sysdig is the only enterprise monitoring solution to be fully compatible with Prometheus, allowing customers to retain their investment in existing Prometheus exporters, configurations, alerts, and dashboards, the company explained.
“With Sysdig, DevOps and cloud teams can scale their visibility, security, and troubleshooting capabilities with a supported platform that simplifies management,” the company wrote in a post that contains additional details on the product.