Google announced a new Site Reliability Engineering-inspired tool for investigating, understanding, mitigating and recovering from incidents quickly and efficiently. Stackdriver Incident Response and Management (IRM) on Google Cloud Platform is available as an alpha version and features new monitoring tools for SRE journeys.
After facing availability and reliability challenges, Google created SRE and SRE principles for building and operating services effectively and efficiently, responding to issues, and to create a culture of continuous improvement. Out of SRE, Google developed the monitoring, APM and logging tool Stackdriver, which provides a management toolset based on best practices around systems reliability, according to the company. Stackdriver IRM is the company’s next step in toward observability, it explained.
“As we continue to evolve our monitoring tools, we want to make it as easy as possible for you to start or evolve your SRE journey. While implementing SRE into an organization is an in-depth process, tools like Stackdriver IRM are inspired by SRE and the ways it can improve user experience with IT services,” Melody Meckfessel, VP of engineering at Google, wrote in a post. “Stackdriver IRM surfaces the violating metric and status of an alert. It incorporates alerting policy documentation and a playbook that shows you how to handle typical cases. And, based on the context of the incident and your environment, it provides insights to highlight key information to accelerate the investigation process.”
It features end-to-end incident life cycle management, SRE-inspired processes for multi-responder incident management, auto-correlation of up-to-date Stackdriver data, and the ability to improve contextual awareness.
In addition, Google is partnering with Blue Medora and Grafana Lab to provide new Stackerdriver integrations.
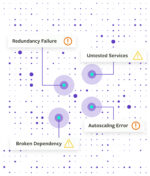
“With today’s distributed infrastructures, IT teams tasked with site reliability and availability need to rely on a wide array of signals to conduct deep analysis when detecting and triaging an issue. The source of an infrastructure performance problem isn’t always obvious, and signals of a problem may come from many places, including the infrastructure layer, operating systems, networking, services and the application layers,” Meckfessel wrote.
Blue Medora will provide observability for resources including cloud environments, infrastructure, networking appliances, databases, storage environments, and line-of-business apps.
Grafana Labs will provide more visualization operations and include observability dashboards and monitoring data analytics.
“Every developer and operator deserves this level of automation for speed, security, and safety. We plan to expand our ecosystem to enable SREs and Ops teams to become ever more effective in operating their applications reliably,” Meckfessel wrote.